

I’ll admit it. When the jackpot climbs past a billion, I start doing the math on what I’d do with it, same as everybody else in line at the gas station. So I went looking for the real numbers behind the lottery: who plays, what they spend, what the odds actually are, and what happens to people who win. A lot of what “everybody knows” turns out to be wrong, including the most repeated lottery-winner statistic on the internet.
Please note that some of the images in this article were created with the assistance of AI.
Before the list, a quick gut check.
12. Americans Spent $110 Billion on Lottery Tickets in 2024
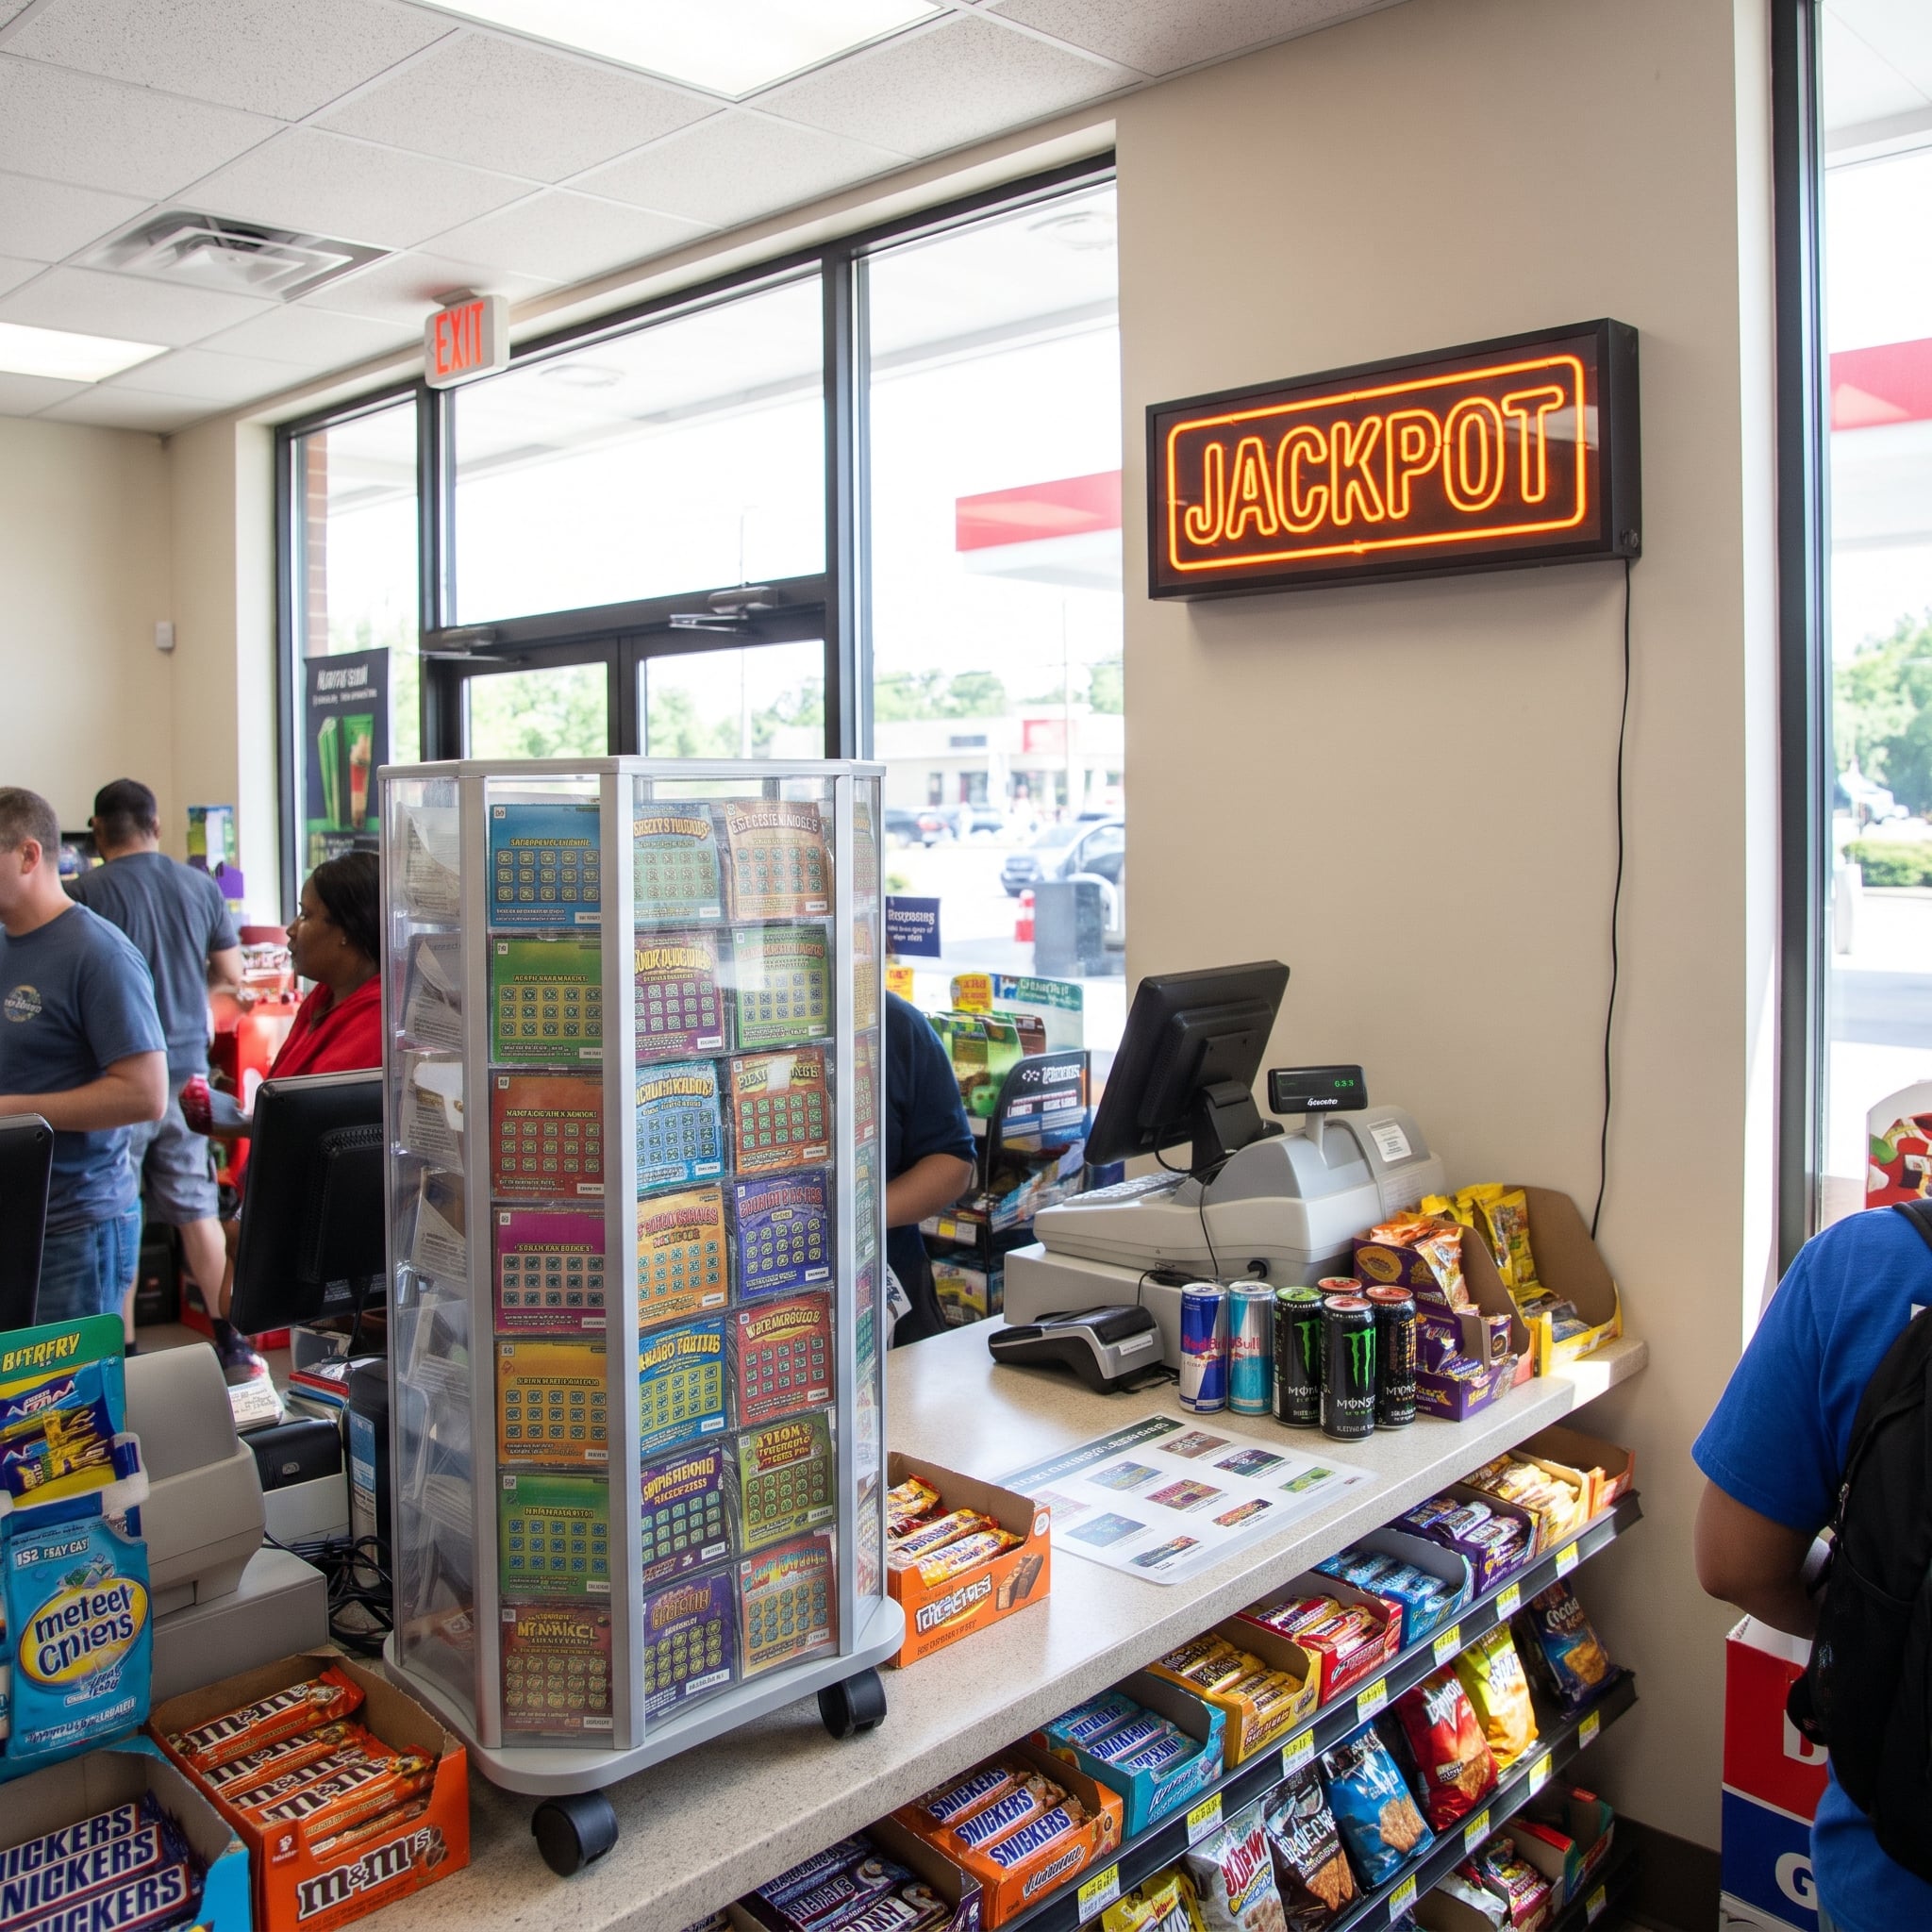
That’s not a typo. A LendingTree analysis of U.S. Census Bureau data puts total 2024 lottery spending at about $110.4 billion, up from roughly $103 billion in 2022. Spread across every resident, that works out to $323 a person.
Here’s the part that stuck with me. The same analysis puts average winnings at $215 per person. So as a country, we hand over $323 and get about $215 back, roughly two-thirds. The rest goes to retailers, running the games and the states.
11. Massachusetts Spends More Per Person Than Any Other State

Massachusetts residents averaged $904 each on lottery tickets in 2024, the highest in the country by a wide margin. Virginia came second at $630 and Rhode Island third at $567. At the other end, North Dakota averaged just $51 a person.
Five states don’t have a state lottery at all: Alabama, Alaska, Hawaii, Nevada and Utah. Nevada’s absence is the funny one, since you can gamble on almost anything else there.
10. Fewer Americans Are Playing Than a Decade Ago
Even with spending that high, the share of people buying tickets has dropped. In Gallup’s 2026 phone survey, 31% of U.S. adults said they’d bought a state lottery ticket in the past year. In 2016 it was 49%.
Put those two facts together and you get a smaller group of players buying more tickets each. Gallup also noted that its web survey produced higher gambling numbers than the phone survey, so the exact figure depends on how you ask.
9. Powerball Odds: 1 in 292,201,338

To win the Powerball jackpot you have to match five white balls drawn from 69, plus one red Powerball drawn from 26. There are 11,238,513 ways to pick the five white balls, and 26 possible Powerballs, which multiplies out to 292,201,338 possible tickets. You hold one of them for $2.
Drawings happen three times a week, Monday, Wednesday and Saturday. Your odds of winning any prize at all are about 1 in 25, which is mostly how the game keeps people coming back.
8. Mega Millions Now Costs $5 a Ticket
In April 2025, Mega Millions raised its price from $2 to $5. In exchange, it removed one Mega Ball from the drum, which nudged the jackpot odds from 1 in 302,575,350 to 1 in 290,472,336, and it raised the minimum jackpot to $50 million.
So the odds got slightly better and the ticket got 150% more expensive. Per dollar spent, you’re buying a much smaller slice of a chance than you used to.
7. Your Lucky Numbers, Age and State Don’t Change Your Odds

This is the one people argue with me about. Every ticket in a drawing has exactly the same chance as every other ticket. Birthdays, “hot” numbers, the store that “always sells winners,” your age, your state: none of it moves the odds by a single ticket’s worth.
Stores that sell lots of winners are usually just stores that sell lots of tickets. The only thing that changes your personal odds is how many tickets you buy, and the Reality Check above shows how little even a big habit moves the needle.
6. Lightning Is a Better Bet Than the Jackpot

The National Weather Service puts your lifetime odds of being struck by lightning at about 1 in 15,300, assuming an 80-year life. One Powerball ticket is 1 in 292 million.
Even someone who buys a Powerball ticket every week from age 30 to 80 ends up with lifetime jackpot odds of about 1 in 112,000. That’s still several times less likely than a lightning strike.
5. The Biggest Jackpot Ever Was $2.04 Billion
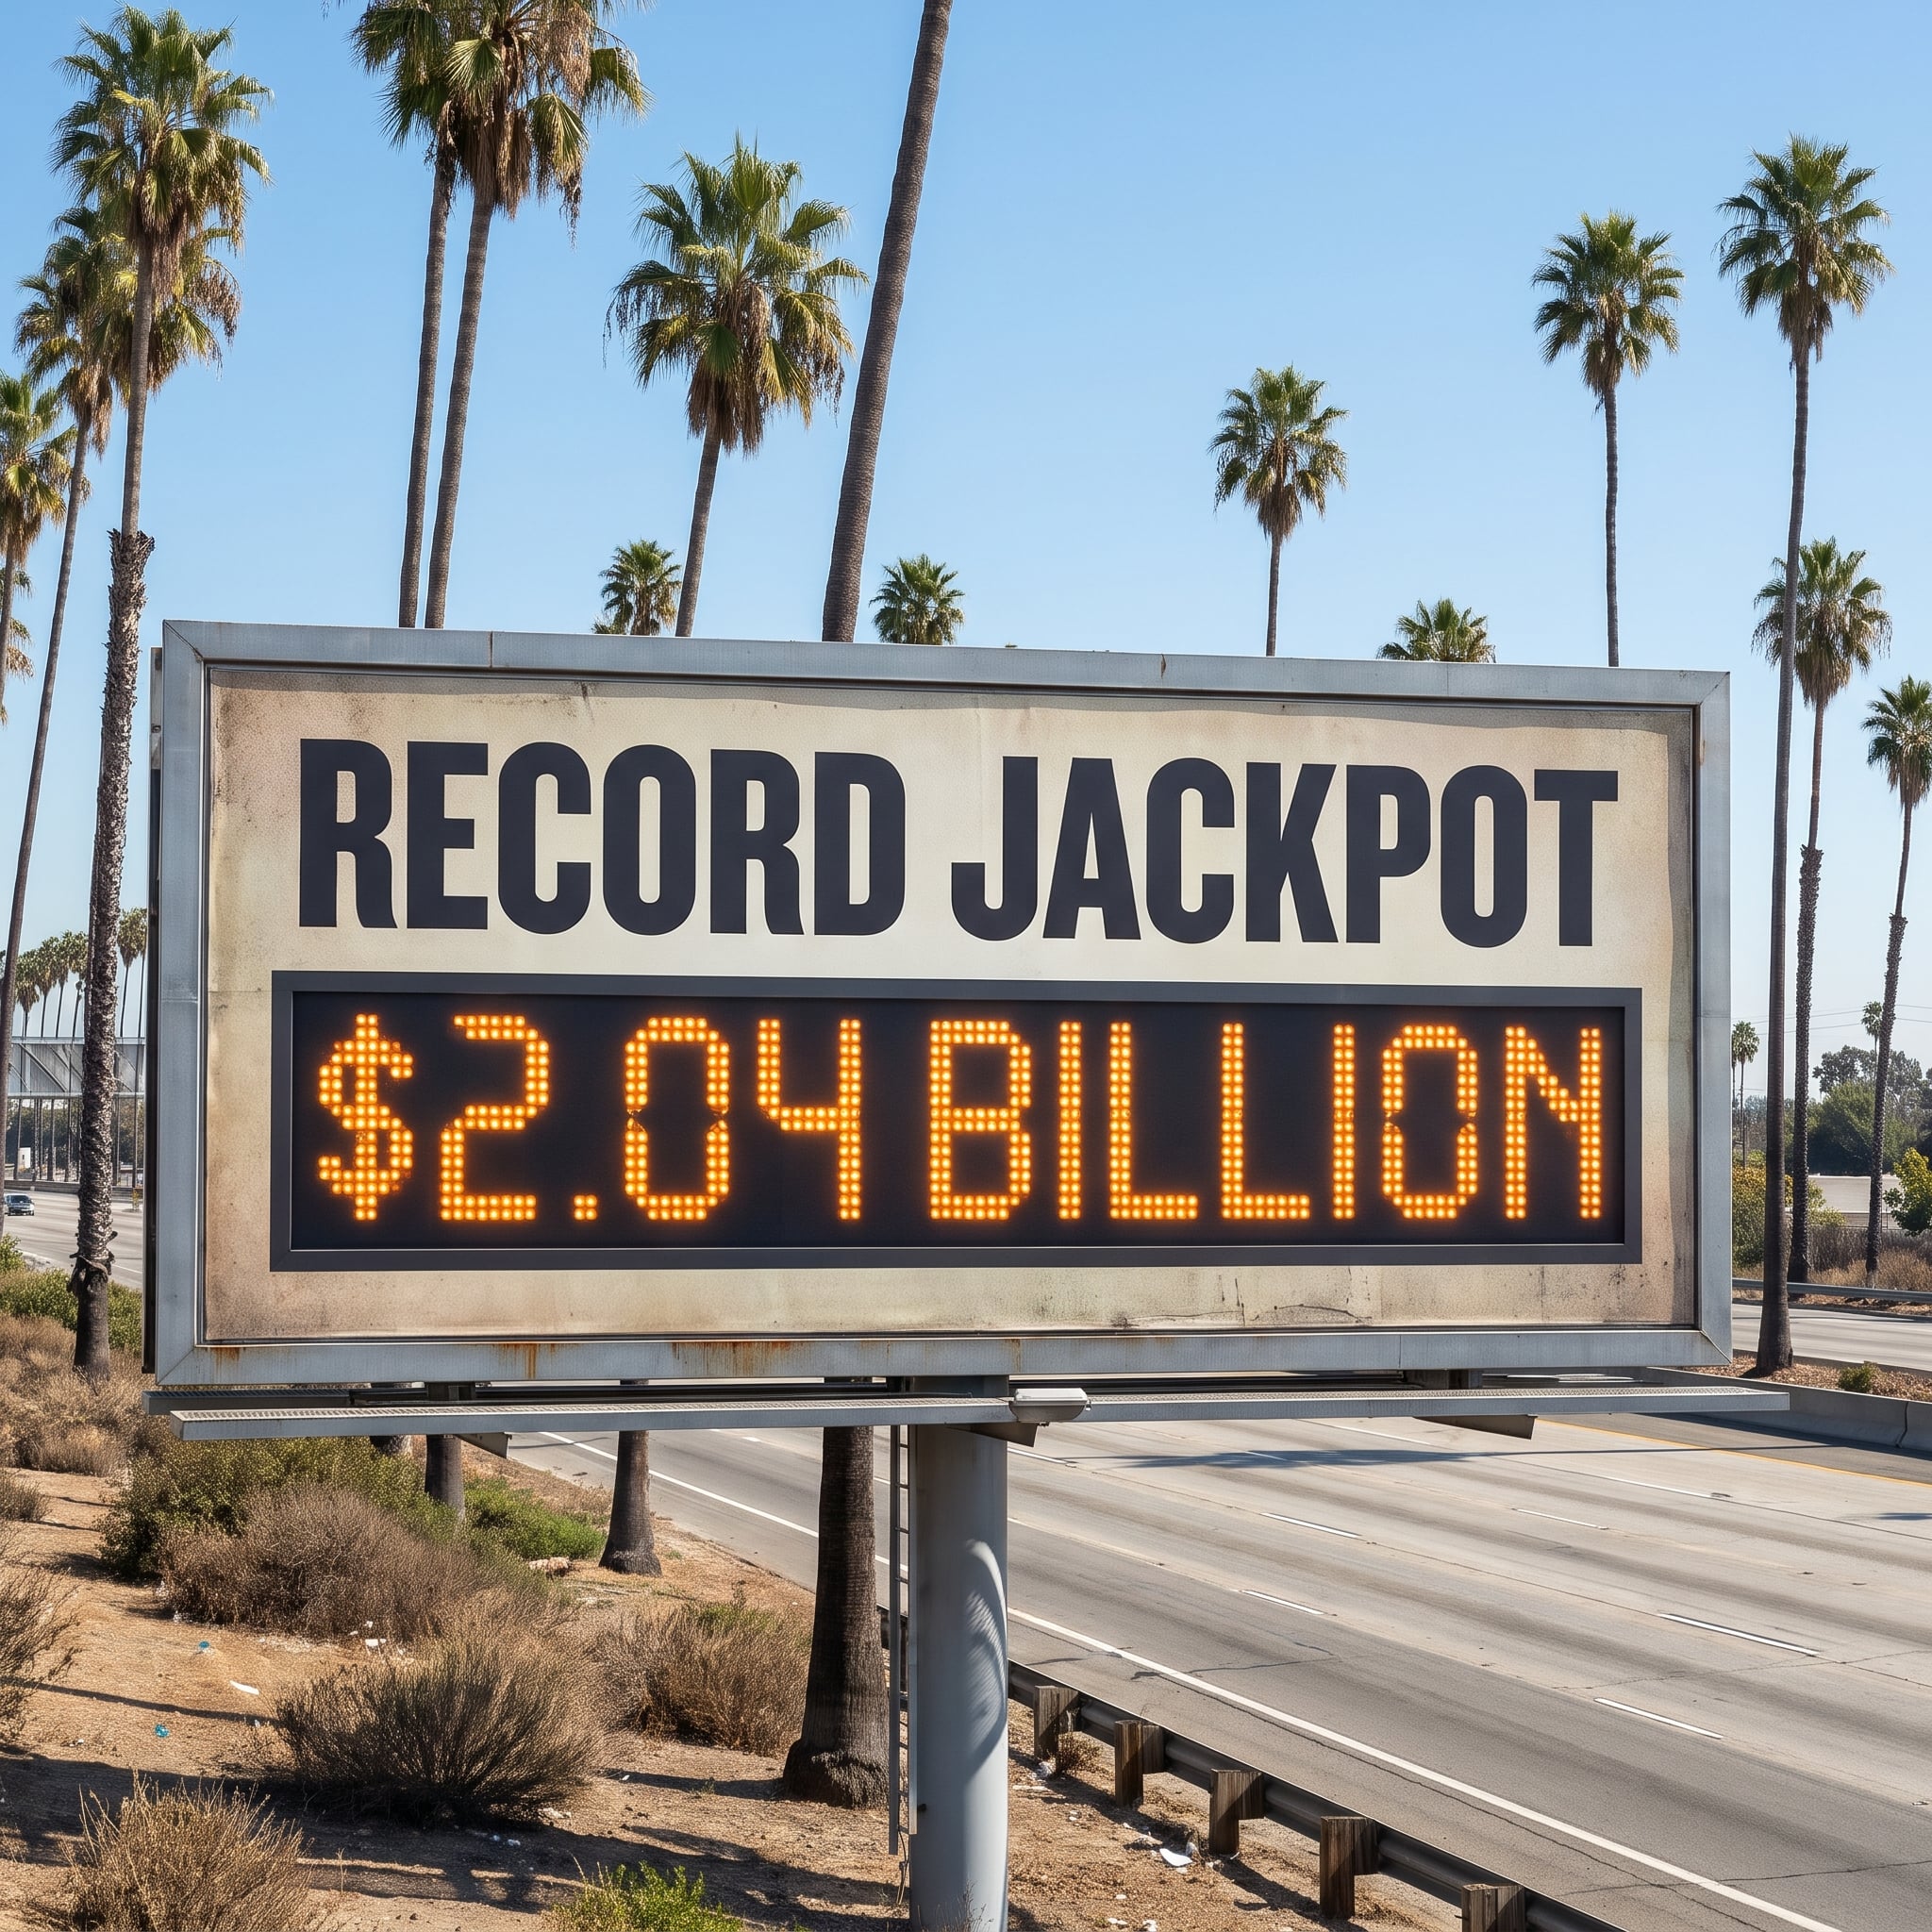
The record belongs to the Powerball drawing of November 2022. One ticket, sold at a service station in Altadena, California, matched all six numbers for a $2.04 billion jackpot, the largest lottery prize in history.
The winner didn’t walk away with $2 billion, though. The advertised jackpot is the total of 30 yearly payments. The winner took the lump-sum cash option instead, which was $997.6 million before taxes.
4. “70% of Lottery Winners Go Broke” Is a Myth
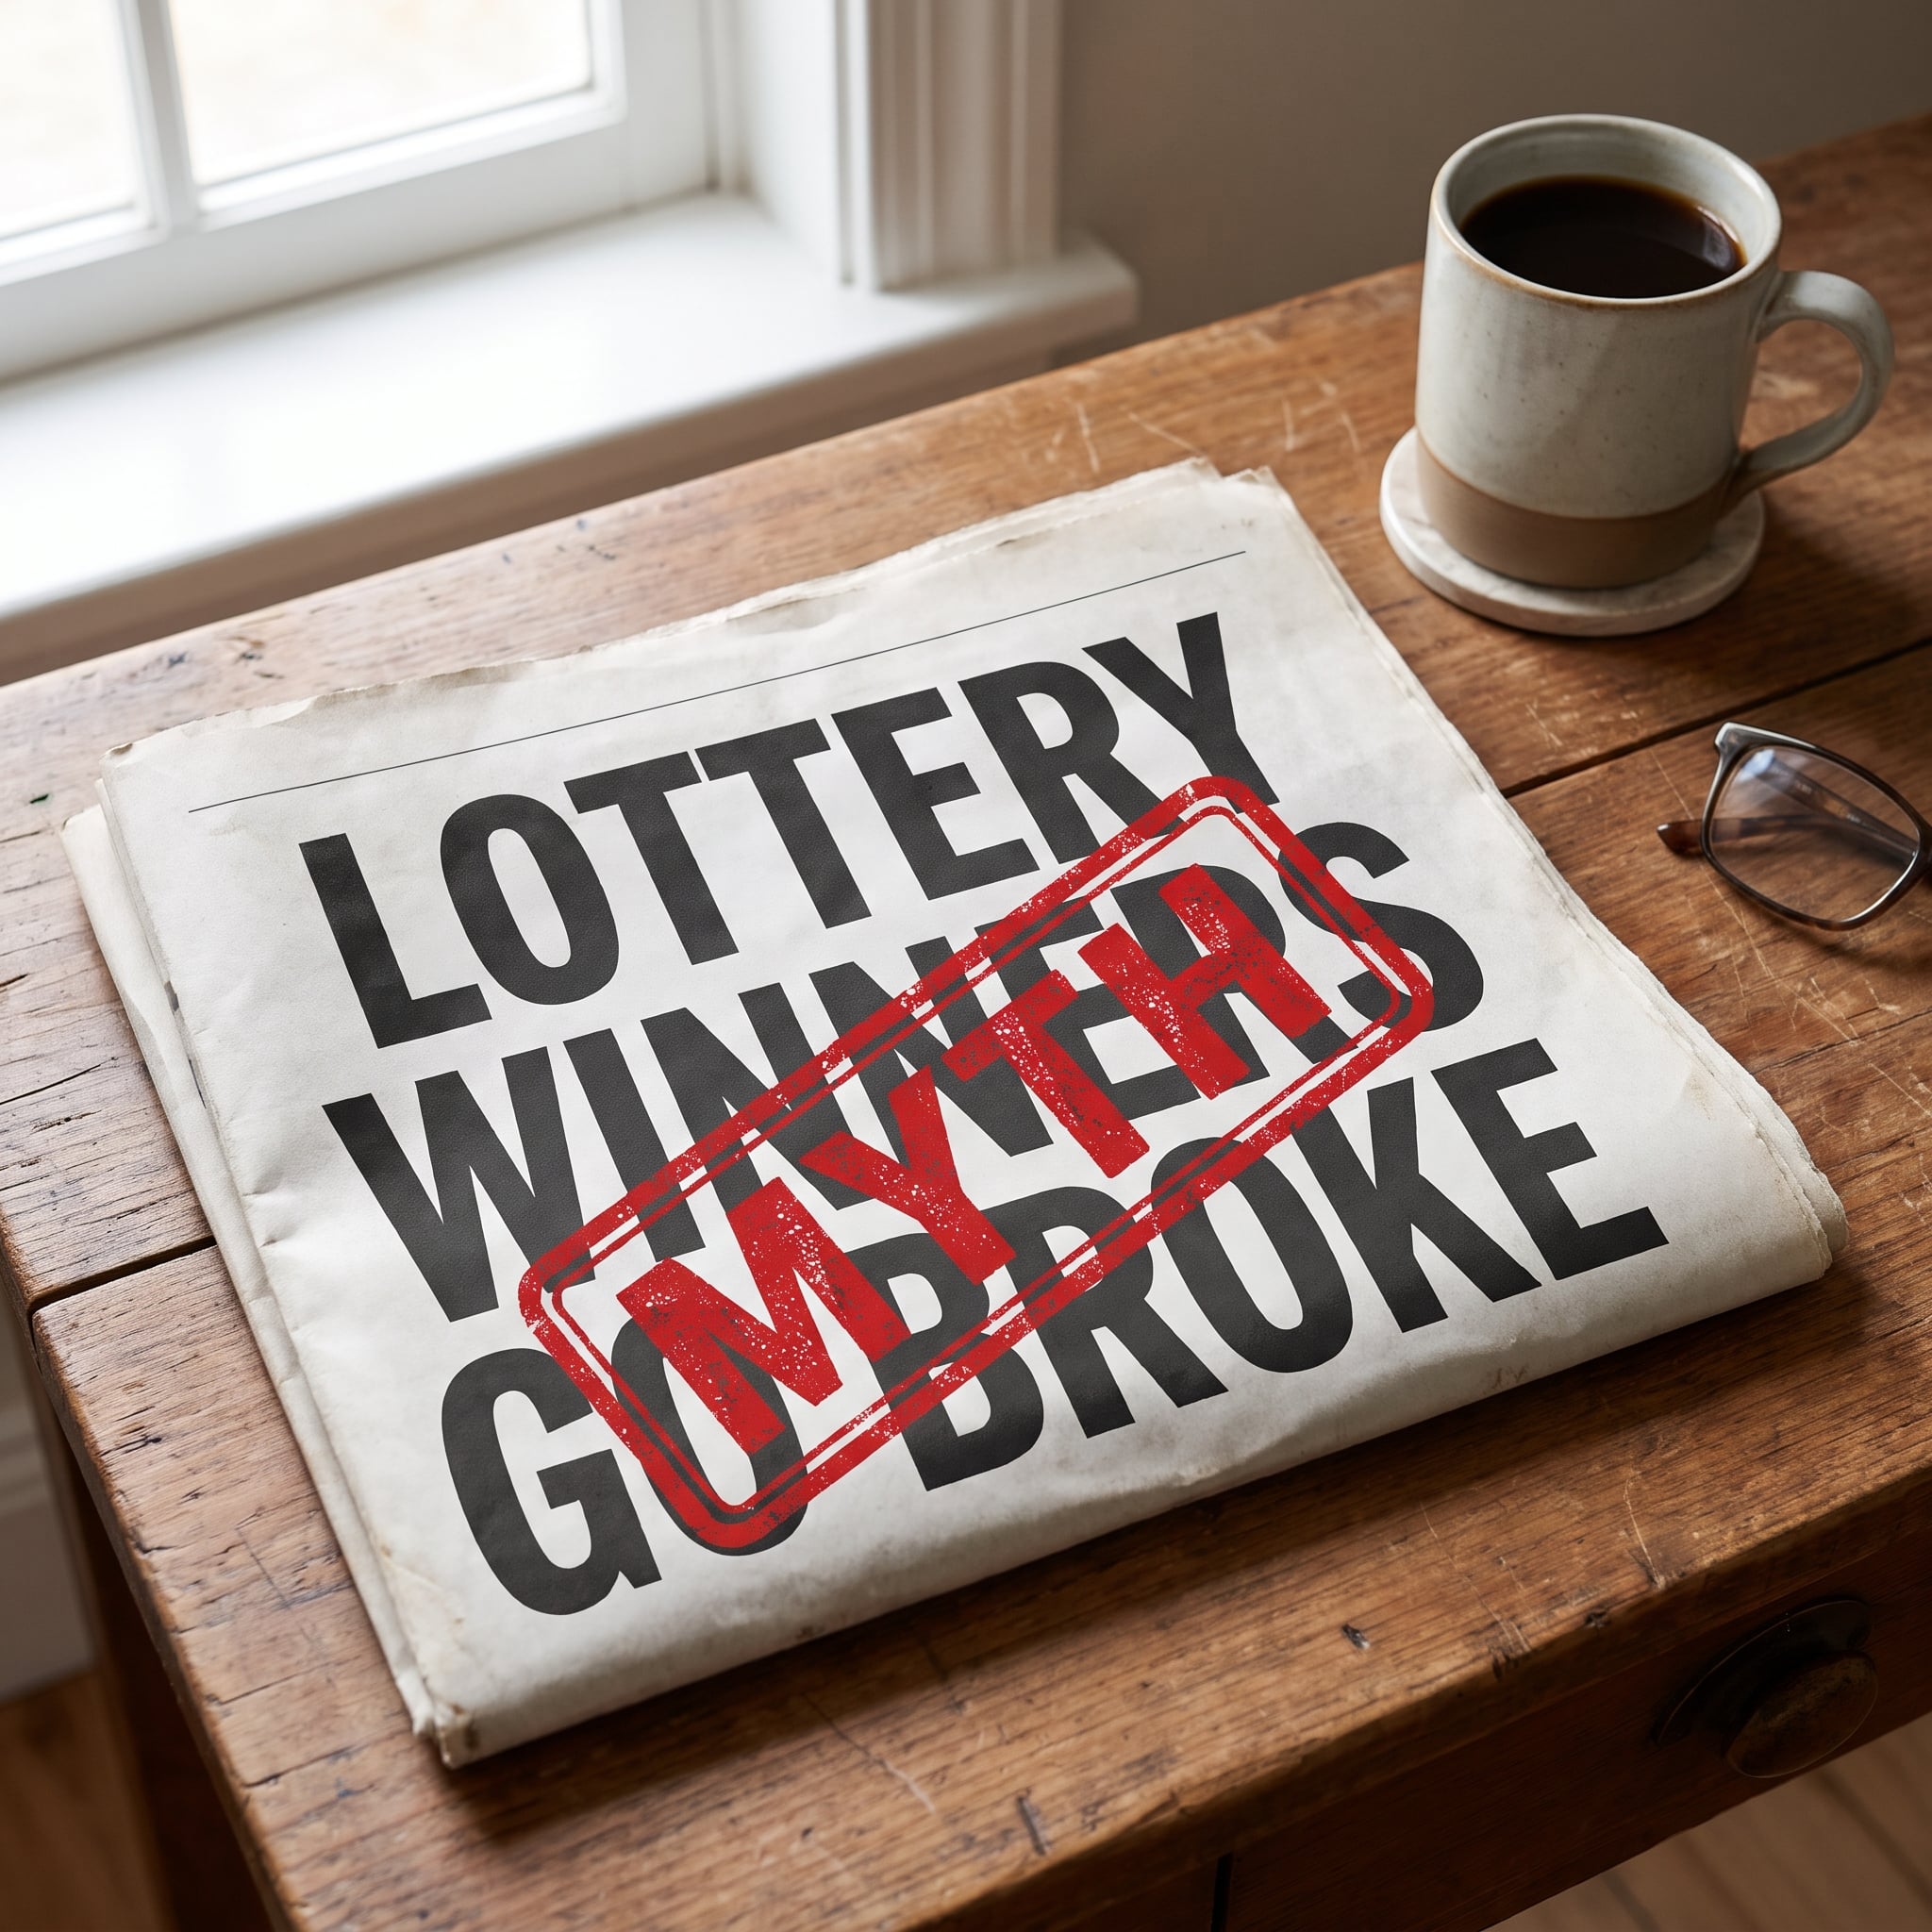
You’ve seen it everywhere: seventy percent of lottery winners go broke within a few years. It’s usually credited to the National Endowment for Financial Education. In 2018, the NEFE said publicly that the statistic is not backed by its research and that it cannot confirm it.
The NEFE says the figure most likely came from a participant at a symposium it held in 2001, and nobody ever verified it. It just got repeated until it sounded true.
3. For Florida Winners, a Big Prize Only Delayed Bankruptcy

Here’s what real data shows. Economists Scott Hankins, Mark Hoekstra and Paige Marta Skiba studied Florida Lottery winners and published the results in 2011. They compared people who won $50,000 to $150,000 with people who won less than $10,000.
If a windfall that size really fixed people’s money problems, the bigger winners should have stayed out of bankruptcy court. They didn’t. The researchers concluded that the bigger prizes only delayed bankruptcy rather than preventing it.
2. Winners Keep Working, Just a Little Less

The dream is the resignation letter the morning after. A large study of Swedish lottery players, published in the American Economic Review in 2017, found something much quieter. Winners did reduce how much they worked, starting right after the win, and they kept those lower earnings for at least ten years.
The cut was modest, not dramatic. Spouses of winners cut back too, just by less than the winners themselves.
1. Money Does Buy Some Happiness

The best news on this list comes from Sweden too. Researchers surveyed big lottery winners 5 to 22 years after their win and published the results in 2020. Compared with similar people who didn’t win, the big winners reported higher life satisfaction, and it lasted more than a decade.
The effect on day-to-day happiness and mental health was smaller. But the old line that winning ruins your life doesn’t hold up. On average, the money made life better.
Sources: LendingTree analysis of U.S. Census Bureau data (2024) · Gallup, 2026 · Gallup, 2016 · NBC News on the Mega Millions change · National Weather Service lightning odds · NPR on the $2.04 billion jackpot · ABC7 on the lump sum · NEFE statement, 2018 · Hankins, Hoekstra and Skiba, Review of Economics and Statistics (2011) · Cesarini et al., American Economic Review (2017) · Lindqvist, Östling and Cesarini, Review of Economic Studies (2020)